

An ApoB that's normal for your age is a healthy ApoB
Short answerNo
On this page
No. ApoB creeps up about half a point a year through young adulthood, and the 2026 US guideline says that rise “should not be perceived as optimal”. The goals stay the same at every age. The middle untreated American adult already has an ApoB of 90, which is the top of the goal for borderline risk.
What we’d do
Ignore any comparison with people your age. Hold your ApoB against the goal for your risk, under 90, 70 or 60 mg/dL, the same at 30 as at 70. If you’re young and your number is high, take it more seriously, not less, because the years ahead are the ones it gets to work on. And if you’re a woman in your late 40s or early 50s, check the timing of your last period before you make much of a jump.
If you remember three things
- The rise with age isn’t healthy. The guideline says so in those words.
- The goals don’t move. Under 90, 70 or 60, by risk, at any age.
- Young numbers count. In CARDIA, ApoB in young adults predicted plaque 25 years later.
Why people believe it
Most blood tests come with ranges, and for some markers it makes sense to compare you with people like you. It’s natural to want to know where you stand against people your age, and to feel reassured if you’re in the middle.
Common and healthy are different things. A traffic jam is normal on a highway at 5 in the evening, and it’s still a traffic jam.
What the guideline says
The 2026 guideline puts it directly. It says it’s common for these numbers to rise in young adults, about 1 to 2 mg/dL a year for LDL and non-HDL and about 0.5 mg/dL a year for ApoB, “although this normative increase should not be perceived as optimal”. Its goals are set by risk, not by age. A 35 year old and a 65 year old at borderline risk share the same matched ApoB goal, under 90.
Average is already high
The National Lipid Association’s 2024 table of 12,696 untreated American adults from NHANES, a US government health survey, puts the middle of the country at an ApoB of 90. That’s right on the top of the goal for borderline risk. Fewer than 1 in 10 untreated adults are under 60, and an ApoB of 120, where the guideline says risk goes up, is about the 86th percentile.
The grid has one bead for each percentile of untreated US adults, aged 18 to 85 together. The lit bead is 90, the middle. Being average here means being right on a goal line, and the table doesn’t split by age, so there’s no “normal for 50” to hide behind.
Like interest on a loan
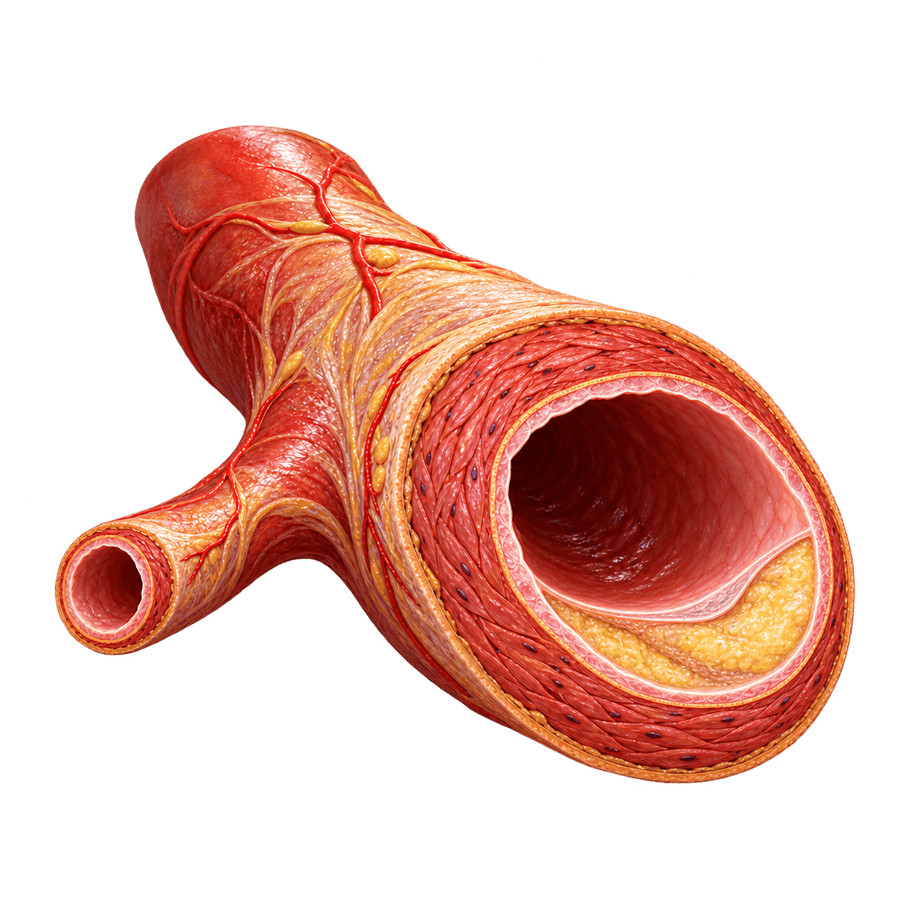
Plaque builds a little each year from the particles that get caught in your artery walls, so the total depends on how high your ApoB was and for how long. It works like interest on a loan. A balance that’s normal for your age still charges interest every year, and the earlier you pay it down, the less you pay in total.
Young numbers predict later plaque
CARDIA is a US study that recruited 2,794 young adults aged 18 to 30, measured their ApoB, and scanned their heart arteries for calcium 25 years later. Compared with the people in the lowest third for ApoB, those in the middle third had 1.53 times the odds of calcium by midlife, and those in the top third 2.28 times, after allowing for the usual risk factors. People whose ApoB was high while their LDL was low had 1.55 times the odds. What you carry in your 20s shows up in your 40s and 50s.
The gene research points the same way. In a 2019 study of 654,783 people, genes that lowered ApoB by 10 points from birth went with about 23% lower odds of heart disease.
The one age effect that’s real
Women get a jump in ApoB around menopause that age alone doesn’t explain. In SWAN, a US study that followed 1,054 women through their last period with yearly checkups, total cholesterol, LDL and ApoB were the only risk factors that rose sharply in the year before and after it. That rise is real. It’s a reason to time your tests with your last period in mind, and the goals stay put (why ApoB jumps around menopause).
The best case for the myth
A skeptic would point out that age itself raises heart risk, so an older person with the same ApoB as a younger one has more risk overall. That’s true, and it’s why your doctor’s risk estimate, and so your goal, takes age into account. But the risk band does that job. The ApoB goal for each band stays the same, and neither the 2026 guideline nor the NLA’s table sets a higher ApoB goal for older people.
cholesterol.guide has the same argument for LDL.
6 sources
- Blumenthal RS, Morris PB, Gaudino M and others, 2026 ACC/AHA guideline on the management of dyslipidemia, JACC and Circulation, 13 March 2026doi.org
- The same guideline, full text, Circulation, 2026api.iscpcardio.org
- Soffer DE, Marston NA, Maki KC and others, Role of apolipoprotein B in the clinical management of cardiovascular risk in adults: an Expert Clinical Consensus from the National Lipid Association, Journal of Clinical Lipidology, 2024pmc.ncbi.nlm.nih.gov
- Wilkins JT and others, Discordance between apolipoprotein B and LDL-cholesterol in young adults predicts coronary artery calcification: the CARDIA study, JACC, 2016pmc.ncbi.nlm.nih.gov
- Matthews KA and others, Are changes in cardiovascular disease risk factors in midlife women due to chronological aging or to the menopausal transition? (SWAN), JACC, 2009pubmed.ncbi.nlm.nih.gov
- Ference BA and others, Association of triglyceride-lowering LPL variants and LDL-C-lowering LDLR variants with risk of coronary heart disease, JAMA, 2019pmc.ncbi.nlm.nih.gov